Mortgage rates are not one-size-fits-all. While national headlines report a single average, the rate you actually receive depends heavily on where you live. State-level differences in lender competition, housing demand, property taxes, regulatory costs, and local economic conditions create a patchwork of rates across the country — and the gap between the cheapest and most expensive states can mean tens of thousands of dollars over the life of a loan.
This guide breaks down how mortgage rates vary by state, what drives those differences, and how to use this information to make a smarter borrowing decision. Use a mortgage calculator to see how even a small rate difference changes your monthly payment and total interest cost.
National Mortgage Rate Overview in 2026
Before diving into state-level data, it helps to know where the national averages stand. As of August 2026, the 30-year fixed-rate mortgage averages approximately 6.65% according to Freddie Mac’s Primary Mortgage Market Survey. The 15-year fixed-rate mortgage sits around 5.95%, and 5/1 adjustable-rate mortgages hover near 6.40%.
These national figures have held relatively steady throughout the first half of 2026. The Federal Reserve has kept the federal funds rate in the 3.50%–3.75% range after a series of cuts in late 2024, and mortgage rates have remained in the mid-6% territory as a result. The spread between the 10-year Treasury note yield and the 30-year mortgage rate currently sits around 1.9 percentage points — wider than the historical average of 1.5%, reflecting ongoing market uncertainty.
For individual borrowers, however, the national average is just a starting point. Your actual rate depends on your credit score, down payment, loan type, debt-to-income ratio, and — crucially — the state where the property is located.
How Mortgage Rates Vary by State
Mortgage rates across the 50 states typically span a range of 0.3 to 0.5 percentage points from lowest to highest. That may sound modest, but on a $350,000 loan over 30 years, a 0.4% rate difference translates to roughly $85 per month and over $30,000 in total interest.
States with the lowest average rates tend to share certain characteristics: strong lender competition, stable housing markets, lower default histories, and borrower populations with higher average credit scores. Conversely, states with higher rates often have thinner lender pools, elevated foreclosure risk, or regulatory environments that increase the cost of lending.
Here’s a snapshot of how average 30-year fixed mortgage rates break down by region, based on aggregated lender data from early-to-mid 2026.
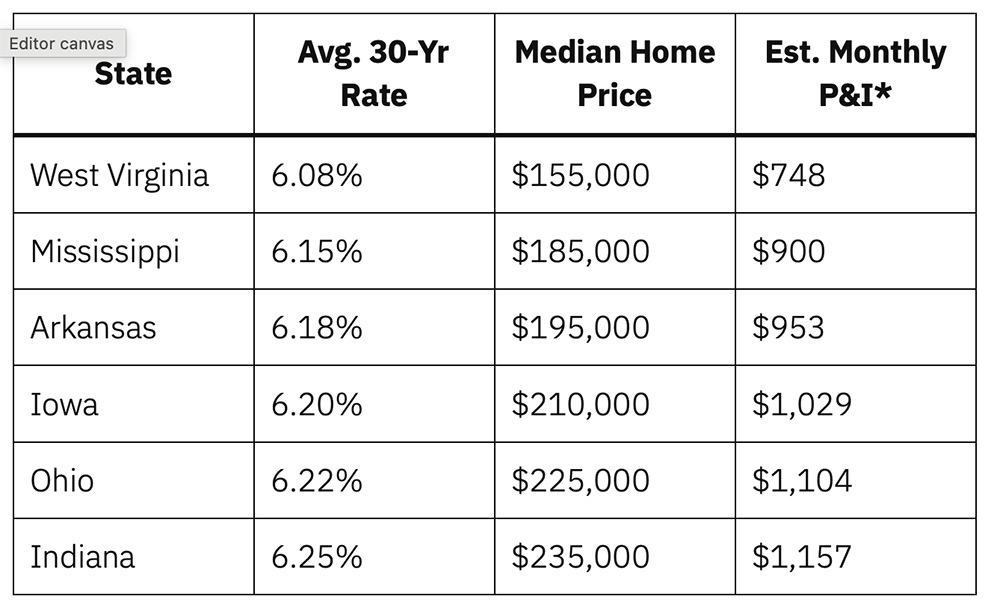
Lowest-rate states (approximately 6.30%–6.45%):
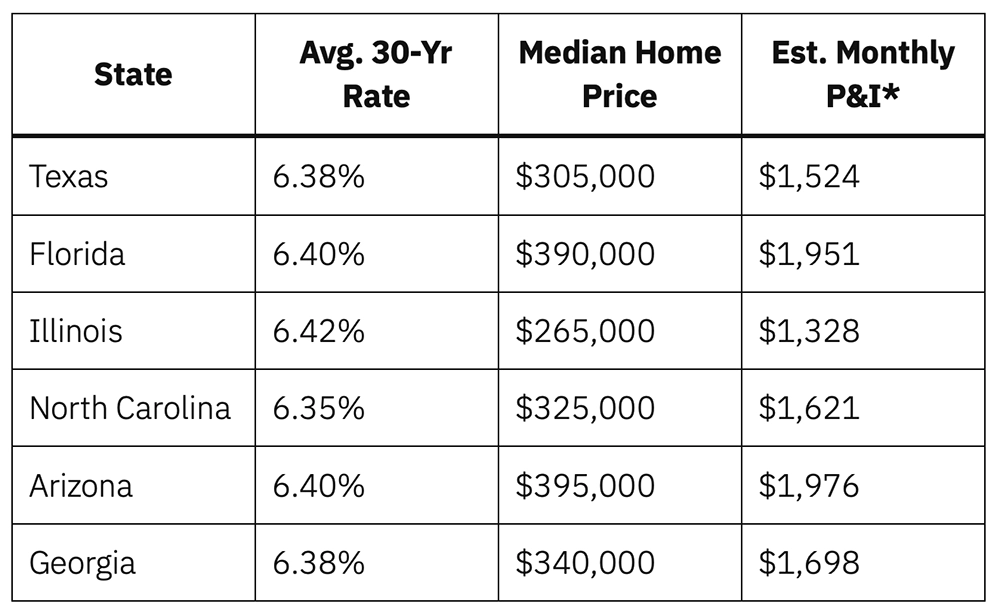
Mid-range states (approximately 6.35%–6.50%):
Highest-rate states (approximately 6.45%–6.55%):
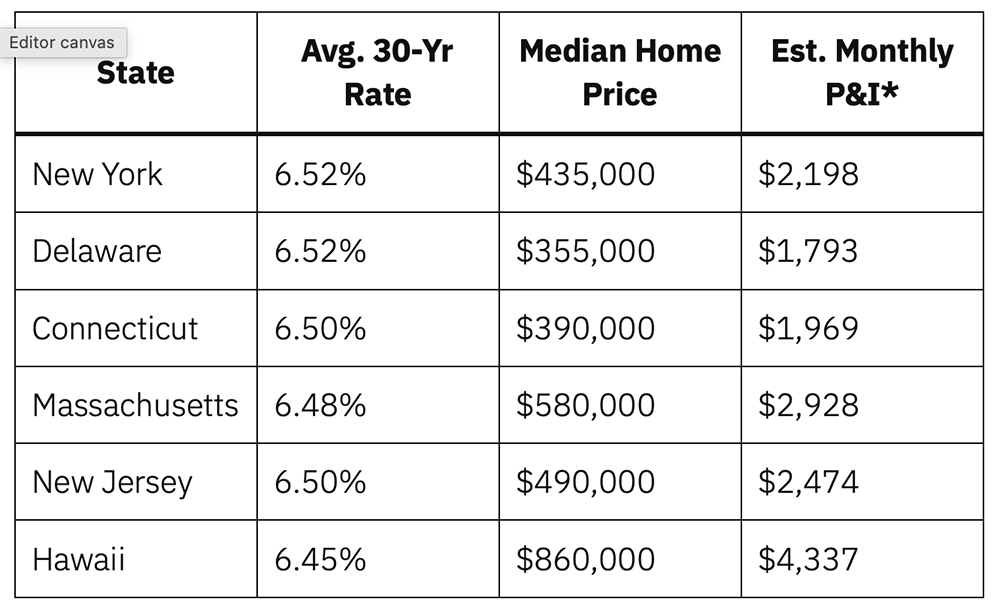
*Estimated monthly principal and interest based on a 20% down payment and a 30-year fixed-rate loan.
These figures shift daily, so always check the latest rates using a mortgage calculator before making decisions.
Why Mortgage Rates Differ From State to State
The variation isn’t random. Several interconnected factors push rates higher or lower depending on where you’re buying.
Lender competition is one of the biggest drivers. States with large populations and active housing markets — like California, Texas, and Florida — attract more lenders competing for business, which tends to push rates down. Smaller or more rural states with fewer lenders often see slightly higher rates because borrowers have fewer options.
State regulations and closing costs also play a role. Some states require an attorney to be present at closing, impose mortgage recording taxes, or mandate specific types of title insurance. New York, for example, charges a mortgage recording tax that adds a direct cost to borrowing. These expenses don’t always show up in the interest rate itself, but they influence the overall cost of lending in that state and can affect how lenders price their products.
Default risk and foreclosure history matter to lenders’ risk models. States with historically higher foreclosure rates or judicial foreclosure processes (which are slower and more expensive for lenders to resolve) may see slightly elevated rates as lenders price in the added risk. States with non-judicial foreclosure — where the process is faster and cheaper — typically offer marginally better rates.
Housing market conditions including median home prices, inventory levels, and how quickly homes are selling all factor into lender risk assessments. In overheated markets where prices look stretched relative to incomes, lenders may add a slight premium.
Borrower profiles vary by state too. States where the average borrower has a higher credit score, lower debt-to-income ratio, and larger down payment naturally see lower average rates — not because the state itself gets a discount, but because its borrowers are less risky on paper.
State-by-State Mortgage Payments: The Full Cost Picture
Interest rates tell only part of the story. The total monthly housing cost varies far more dramatically across states because of differences in home prices, property taxes, and insurance premiums.
Consider two borrowers taking out a 30-year fixed mortgage with 20% down:
Buyer in Mississippi:
- Median home price: $185,000
- Loan amount: $148,000
- Rate: ~6.15%
- Monthly P&I: ~$900
- Property tax: ~$95/mo (0.77% effective rate)
- Insurance: ~$130/mo
- Total PITI: ~$1,125/month
Buyer in Massachusetts:
- Median home price: $580,000
- Loan amount: $464,000
- Rate: ~6.48%
- Monthly P&I: ~$2,928
- Property tax: ~$540/mo (1.12% effective rate)
- Insurance: ~$145/mo
- Total PITI: ~$3,613/month
The Massachusetts buyer pays more than three times what the Mississippi buyer pays — driven primarily by home prices, not the 0.33% rate difference. This illustrates why looking at rates alone can be misleading. The true affordability picture requires factoring in all four PITI components.
Property tax rates vary enormously. New Jersey leads the nation with an effective rate around 2.49%, which adds approximately $830 per month on a median-priced home. Hawaii, despite having the most expensive homes, has one of the lowest property tax rates at 0.28%, adding only about $200 per month. Texas has no state income tax but compensates with property tax rates near 1.80%, a significant hidden cost for homebuyers who focus only on the sticker price.
How the Federal Reserve Impacts State-Level Rates
The Federal Reserve doesn’t set mortgage rates directly, but its monetary policy decisions ripple through the entire lending market and affect rates in every state simultaneously.
When the Fed adjusts the federal funds rate — the overnight borrowing rate between banks — it influences short-term interest rates across the economy. Adjustable-rate mortgages are most directly affected, since their rates are tied to indexes like the Secured Overnight Financing Rate (SOFR) that move closely with Fed policy.
Fixed-rate mortgages are influenced more indirectly. They track the yield on the 10-year U.S. Treasury note, which responds to investors’ expectations about future inflation, economic growth, and Fed policy direction. When investors expect higher inflation or more government borrowing, Treasury yields rise and mortgage rates follow.
In 2026, the Fed has held its rate steady after cutting by a total of 1 percentage point in late 2024. Markets currently expect one or two additional cuts later in the year, but ongoing inflation concerns — partially driven by geopolitical instability and trade policy — have kept mortgage rates elevated. If the Fed does cut again, rates could ease across all states, though the relative differences between states would likely remain similar.
Most Affordable States to Buy a Home in 2026
Affordability combines mortgage rates, home prices, and local costs into what matters most: how much of your income goes toward housing. Here are the states where homeownership currently stretches the furthest:
- West Virginia consistently ranks as the most affordable state for homebuyers. Low median home prices around $155,000 combined with some of the lowest average mortgage rates in the country keep monthly payments well under $1,000 for a typical purchase. Property taxes are moderate, and insurance costs are below the national average.
- Mississippi offers median home prices near $185,000 and competitive rates around 6.15%. The state’s lower cost of living means that even with modest household incomes, many families can comfortably afford homeownership.
- Arkansas, Oklahoma, and Iowa round out the top five most affordable states, all featuring median home prices below $220,000 and average rates in the 6.15%–6.25% range. In these markets, a household earning the area median income can typically qualify for a mortgage with room to spare in the budget.
- Ohio and Indiana deserve mention for offering affordable homeownership in states with more diversified economies and access to major metro areas. Cities like Columbus, Indianapolis, and Cincinnati provide urban amenities at a fraction of coastal housing costs.
At the opposite end, Hawaii, California, Massachusetts, Washington, and Colorado present the greatest affordability challenges. In Hawaii, the median home price exceeds $860,000, pushing the average PITI payment above $5,000 per month even with relatively moderate interest rates.
Most Expensive States for Mortgage Borrowers
The most expensive states for mortgage borrowers aren’t always the ones with the highest interest rates — they’re the ones where the combination of home prices, taxes, and insurance creates the heaviest total burden.
Hawaii tops the list with a median home price around $860,000 and average monthly PITI payments exceeding $5,000. Limited land supply, geographic isolation, and high construction costs keep prices persistently elevated.
California follows closely, with coastal markets like San Francisco, Los Angeles, and San Diego pushing the statewide median above $750,000. While inland areas are more affordable, the state average remains among the highest in the nation.
Massachusetts and New Jersey combine high home prices with substantial property taxes. In New Jersey, the effective property tax rate of approximately 2.49% means a homeowner with a $490,000 property pays over $12,000 annually in taxes alone — money that comes on top of the mortgage payment.
New York presents a split picture. New York City and its surrounding suburbs are among the most expensive markets in the country, while upstate areas are far more affordable. The statewide average rate of around 6.52% is among the highest, and the mortgage recording tax adds a direct cost to every purchase.
Connecticut and Washington also rank in the top tier of expensive states, driven by proximity to major employment centers, limited housing supply, and strong demand from high-income buyers.
How to Get the Lowest Mortgage Rate in Your State
Regardless of where you live, you have significant control over the rate you receive. The state average is just a benchmark — individual borrowers routinely beat it by following smart strategies.
- Shop multiple lenders. This is the single most impactful step. Research consistently shows that borrowers who compare offers from at least three to five lenders save an average of $1,500 or more over the life of their loan. Rates can vary by 0.5% or more between lenders in the same market on the same day for the same borrower profile.
- Strengthen your credit score. Your FICO score is the most powerful rate lever you control. Borrowers with scores above 760 routinely receive rates 0.5% to 1.0% lower than those with scores in the 620–680 range. On a $300,000 loan, that difference saves $100–$200 per month.
- Increase your down payment. Putting 20% or more down eliminates PMI and typically qualifies you for the best available rates. Even moving from 10% to 15% down can improve your rate offer.
- Consider buying mortgage points. Paying upfront discount points (each point costs 1% of the loan amount and typically reduces your rate by 0.25%) makes sense if you plan to stay in the home long enough to recoup the cost. On a $400,000 loan, one point costs $4,000 and saves roughly $60 per month — breaking even in about 5.5 years.
- Lock your rate strategically. Mortgage rates move daily. Once you find a rate you’re comfortable with, lock it in — most lenders offer 30- to 60-day rate locks at no extra cost. If you’re in a falling-rate environment, a shorter lock period gives you flexibility; if rates are volatile or rising, lock early.
- Explore different loan types. FHA, VA, and USDA loans often carry lower rates than conventional mortgages. VA loans in particular typically offer the lowest rates available — often 0.25% to 0.5% below conventional — and require no down payment or PMI.
Use a mortgage calculator to compare how different rates, terms, and down payment amounts affect your total borrowing cost before committing.
High-Cost vs. Low-Cost Areas Within the Same State
State averages can obscure dramatic differences within a state’s borders. Many states contain both affordable markets and some of the priciest real estate in the country.
California is the textbook example. The median home price in San Francisco exceeds $1.2 million, while the median in Bakersfield or Fresno falls below $350,000. Borrowers in high-cost metros may need jumbo loans (above the conforming limit of $832,750 in most areas), which carry different rates and qualification standards.
New York shows a similar split. Manhattan and Brooklyn are among the most expensive ZIP codes in America, while cities like Syracuse and Buffalo offer homes at a fraction of the price. The conforming loan limit is higher in designated high-cost areas, which can keep more borrowers in the conventional loan market where rates are typically more competitive.
Florida ranges from relatively affordable markets like Jacksonville and Tallahassee to premium coastal areas like Miami, Naples, and Key West. Insurance costs — particularly for windstorm coverage — add a state-specific burden that varies significantly by county and proximity to the coast.
Texas offers affordable homeownership in many markets, but its high property tax rates (averaging around 1.80%) offset the absence of a state income tax. A home in Austin costs roughly twice what the same square footage goes for in San Antonio, yet both carry similar mortgage rates.
Understanding these intra-state dynamics is important because the conforming loan limit, available lenders, and local competition all change based on your specific market — not just your state.
Mortgage Rate Trends: Where Are Rates Heading?
Predicting mortgage rates with precision is impossible, but understanding the factors that drive them helps you make better timing decisions.
The consensus among mortgage industry analysts heading into late 2026 is that 30-year fixed rates will likely remain in the 6.25%–7.00% range for the near term. Several factors support this forecast.
Inflation remains above the Fed’s 2% target, partly fueled by energy price volatility linked to geopolitical tensions. Until inflation convincingly declines, the Fed is unlikely to cut rates aggressively, which keeps the floor under mortgage rates.
Government borrowing is elevated. High federal deficits require the Treasury to issue more bonds, pushing yields up and dragging mortgage rates higher. This structural pressure is unlikely to ease quickly.
Housing demand is resilient. Despite affordability challenges, demographic factors — particularly millennials entering their prime home-buying years — keep demand strong. High demand supports higher rates because lenders don’t need to lower prices to attract business.
On the positive side, if economic growth slows meaningfully or inflation drops faster than expected, mortgage rates could decline more quickly. Some forecasters project rates reaching the 5.80%–6.20% range by mid-2027 if conditions align.
For buyers, the practical takeaway is straightforward: trying to time the market is risky. If you find a home you can afford at today’s rates, buying now and refinancing later if rates drop is generally a sounder strategy than waiting for a rate dip that may not come.
Frequently Asked Questions
Which state has the lowest mortgage rates right now?
West Virginia consistently reports among the lowest average 30-year fixed mortgage rates in the country, recently averaging around 6.08%. Mississippi, Arkansas, and Iowa also rank among the most affordable states for mortgage borrowing. Keep in mind that individual rates depend on your credit profile, not just your state.
Why are mortgage rates different in each state?
Rates vary due to differences in lender competition, state regulations and closing costs, local economic conditions, foreclosure laws, and the average creditworthiness of borrowers in each state. States with more lenders competing for business and lower regulatory costs tend to have lower average rates.
Does my state affect my mortgage rate more than my credit score?
No. Your credit score has a much larger impact on your individual rate than your state does. The state-to-state rate variation is typically 0.3–0.5 percentage points, while the difference between excellent credit (760+) and fair credit (620–680) can be 0.5–1.0 percentage points or more. Focus on improving your credit profile first.
What is the conforming loan limit for 2026?
The conforming loan limit for most of the U.S. is $832,750 for a single-family home in 2026. In designated high-cost areas — including parts of California, New York, Hawaii, and Washington, D.C. — the limit can be higher. Loans exceeding the conforming limit are classified as jumbo loans and may carry different rates.
How can I find the best mortgage rate in my state?
Compare offers from at least three to five lenders, including banks, credit unions, and online lenders. Check your credit score and address any issues before applying. Consider different loan types (conventional, FHA, VA, USDA) and use a mortgage calculator to evaluate how each offer affects your total borrowing cost over the full loan term.
Are mortgage rates expected to drop in 2026?
Modest declines are possible if the Federal Reserve resumes cutting the federal funds rate later in 2026, but most analysts expect 30-year rates to remain in the mid-6% range through the end of the year. A more meaningful decline — into the high 5% range — is considered more likely for mid-to-late 2027, depending on inflation and economic conditions.
Should I wait for lower rates before buying a home?
Timing the mortgage market is notoriously difficult. If you’ve found a home you can afford at current rates, buying now and refinancing later if rates drop is typically a more reliable strategy than waiting indefinitely. Home prices may continue to rise while you wait, potentially offsetting any savings from a lower rate.
Leave a Reply